How to Measure Your Brand's LLM Citation Share Across AI Search Engines
Last updated: 26 October 2026
To measure LLM citation share, run a sample of 100 prompts through AI search engines or chatbots, then count every URL or domain cited in the responses. Divide your brand's appearances by the total number of citations to get your share as a percentage. This metric reveals how often AI systems recommend your content relative to competitors when answering user queries. The accuracy of your measurement depends on choosing representative prompts and tracking citations consistently across platforms.
What LLM Citation Share Actually Means
LLM citation share is your brand's percentage of all cited-source slots across a defined sample of AI-generated answers. Run 100 prompts, count every URL or domain cited in the responses, and divide your appearances by the total. That ratio is your citation share, and learning how to measure LLM citation share correctly starts with understanding what that ratio actually represents.
The metric differs from traditional search ranking in one important way: position is binary. A source either appears in an AI answer or it does not. There is no page two, no rank 7 versus rank 3. Authoritytech's Share of Citation framework formalizes this, defining citation share as the percentage of cited-source slots your brand occupies across a fixed prompt sample. One caveat worth naming: how you define the denominator changes the number significantly. Share of all citations across every prompt produces a much smaller figure than share within the top-ten cited domains, so any benchmark comparison requires knowing which calculation was used.
On current baselines, LLM citation statistics compiled for 2026 show that citation volume is heavily concentrated. A small number of high-authority domains capture the majority of cited slots across ChatGPT, Perplexity, and Google AI Overviews. Most brands, even well-ranked ones, sit at citation rates below 5% on their core topics. That gap between search visibility and AI citation visibility is the measurement problem this article addresses.
What You Need Before You Start Tracking
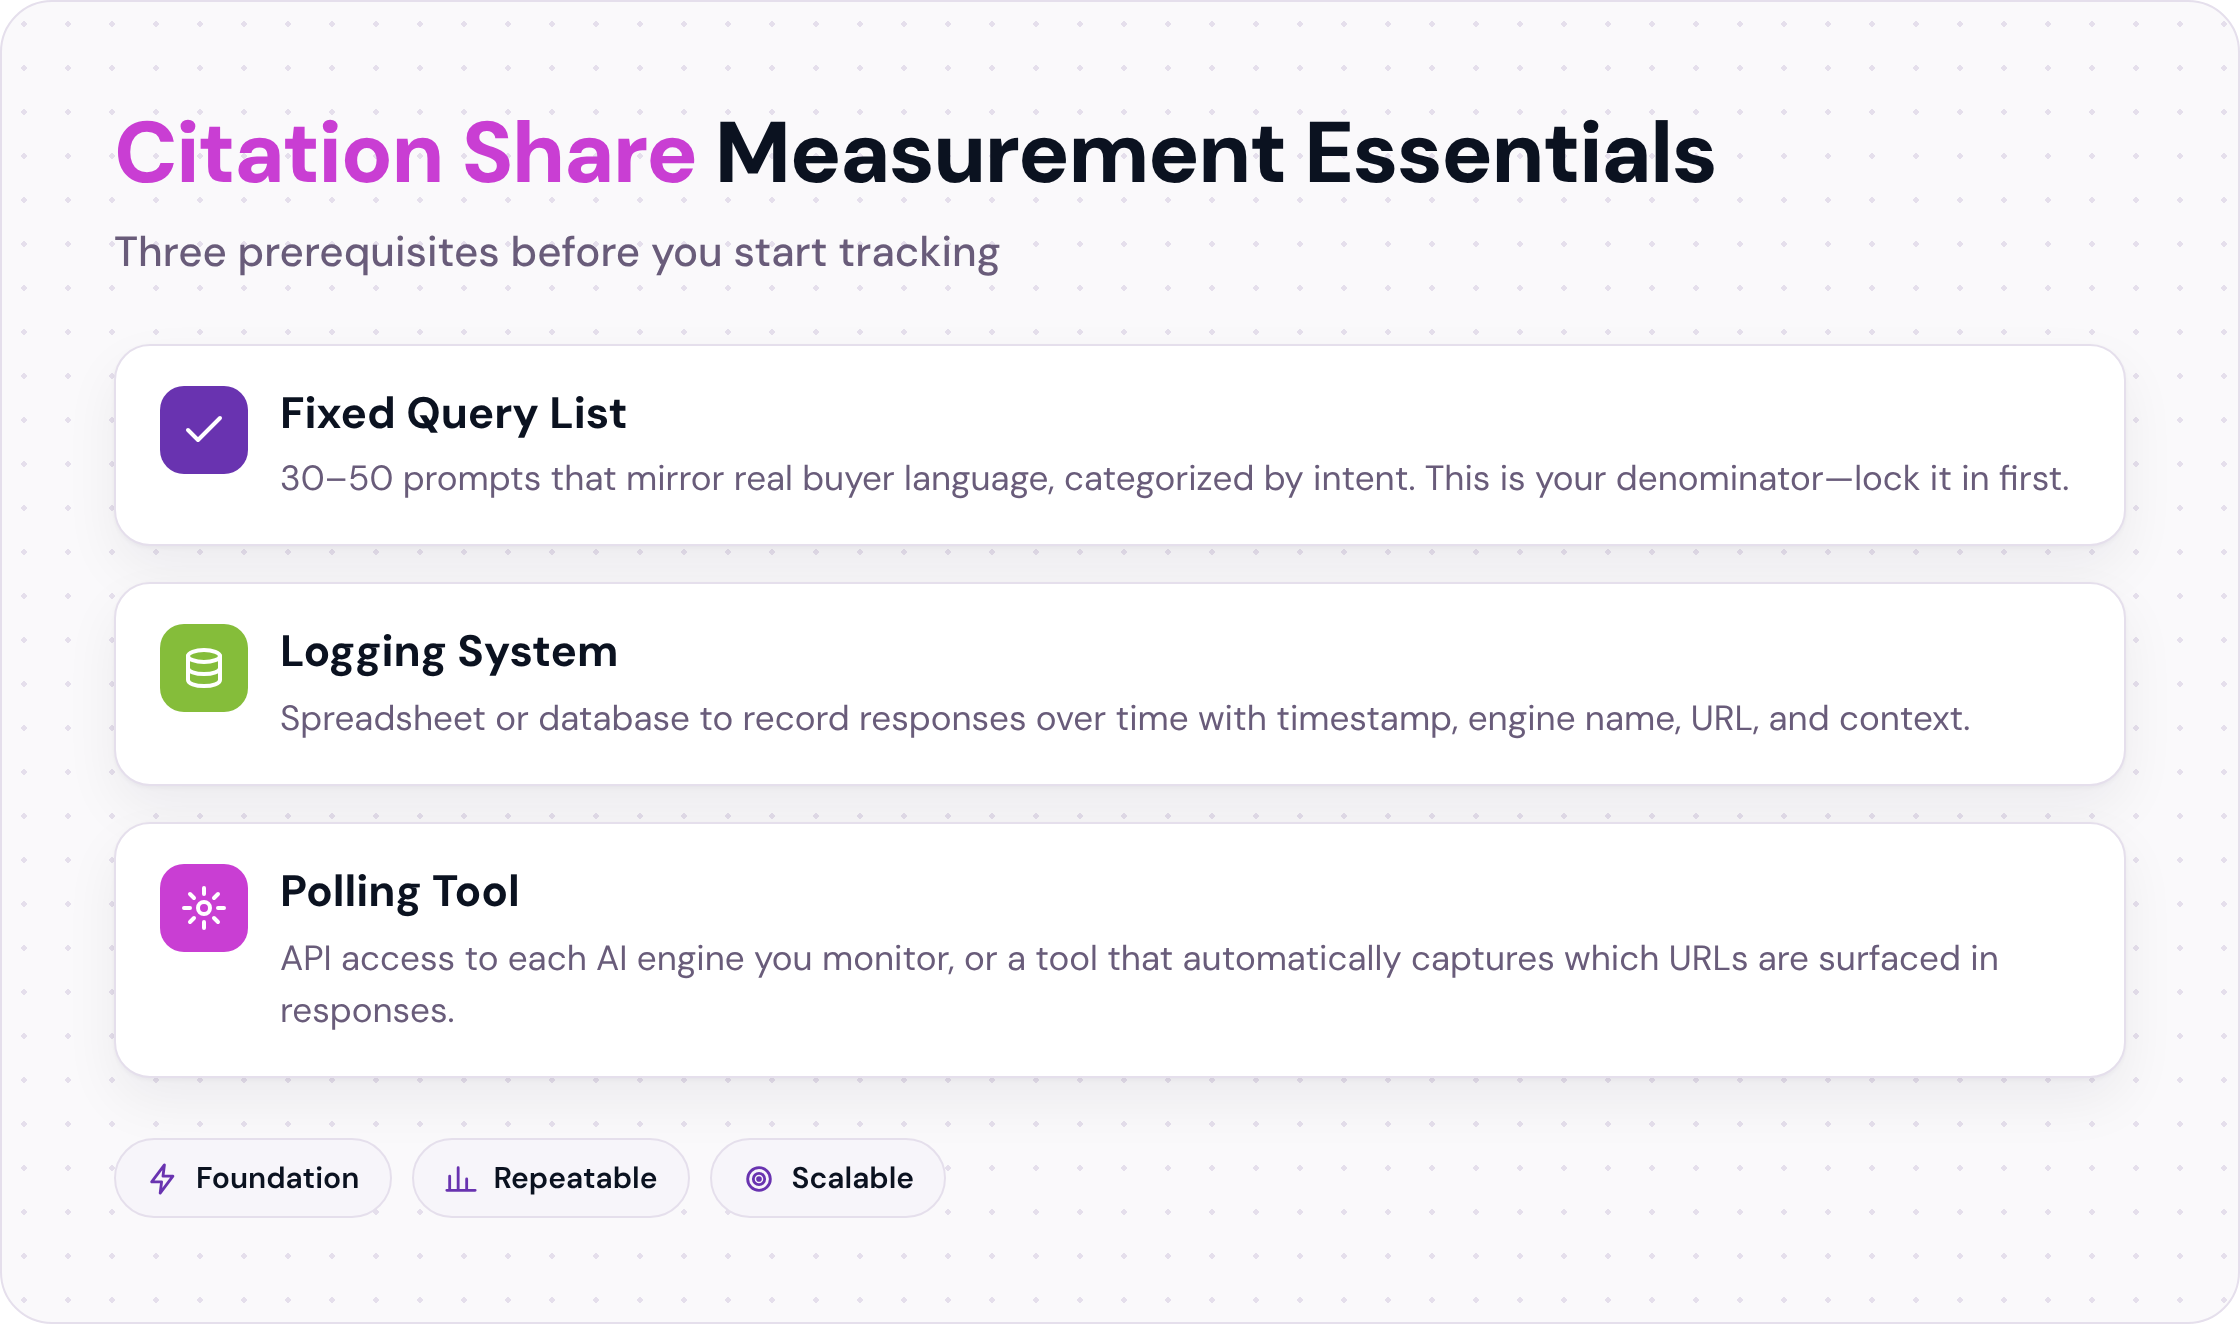
To measure LLM citation share, you need three things in place before any optimization work begins: a fixed set of queries you want to be cited for, a logging system (spreadsheet or database) to record responses over time, and at least one tool that polls AI engines and captures which URLs they surface.
Most teams skip the query list and go straight to tooling. That is the wrong order. Without a stable prompt set, your citation rate shifts every time someone adds a new query, and you end up comparing different data sets each week. The query list is your denominator. Fix it first.
Minimum Tooling
At the low end, you can start with API access to each engine you want to monitor, a spreadsheet to log responses, and a consistent schedule for running queries. That setup works, but it breaks down fast. Manual polling is error-prone, response logging is tedious, and you will miss variance across response runs if you only query each prompt once.
A dedicated citation-tracking platform handles the polling, deduplication, and trend storage automatically. Otterly's citation tracking research puts the typical citation window at 2 to 7 domains per AI response, which means competition for any given prompt is narrow. Consistent tracking matters more than it might seem.
The trade-off: purpose-built platforms add cost and a new vendor dependency. For teams with fewer than 20 tracked prompts and one or two target engines, a well-structured spreadsheet with scheduled API calls is a reasonable starting point. The manual approach breaks down when your prompt set grows past 30 or when you need week-over-week trend data across four engines simultaneously.
Building Your Tracked Query Set
Aim for 20 to 50 prompts. Fewer than 20 gives you too thin a sample to spot patterns; more than 50 creates maintenance overhead that most teams abandon within a month.
Structure the set in three layers.
The first layer covers high-intent buying queries: the questions your prospects type when they are close to a decision, such as "best [category] tool for [use case]." The second layer covers definitional and educational queries where your brand should have authority, like "how does [core concept] work" or "what is [your category]." The third layer covers comparison queries ("X vs Y," "[category] alternatives") where AI engines frequently cite review aggregators and you need to know if you are present.
When selecting specific prompts, pull from your actual search data. Google Search Console query reports, sales call transcripts, and support ticket language are more reliable sources than keyword tools, because they reflect how real buyers phrase questions rather than how SEOs assume they do.
Which Engines to Monitor First
Start with ChatGPT and Perplexity. ChatGPT carries the largest user base of any conversational AI engine as of early 2025, and Perplexity is the engine most likely to surface explicit citations with URLs, making it the easiest to audit manually. Those two give you the broadest coverage for the least setup effort.
Add Gemini next if your audience skews toward Google Workspace users or if your category has strong Google Shopping or Maps overlap. Claude is worth adding once your tracking infrastructure is stable, particularly for technical or research-heavy niches where Anthropic's model tends to get used for longer-form analysis.
The practical limitation: each engine handles citations differently. Perplexity surfaces source URLs directly in its interface. ChatGPT's citation behavior varies by browsing mode and model version. Gemini and Claude are less consistent about naming specific URLs in responses. Signal AI's analysis of AI citation visibility notes that brand surfacing in AI-generated answers depends heavily on which narratives each engine has indexed, not just whether your domain exists. That asymmetry means a citation on Perplexity and a brand mention on Claude are measuring different things, and your logging system needs to account for both.
Step 1: Build a Structured Prompt Library for Citation Audits
A structured prompt library is the foundation of any repeatable LLM citation measurement program. Write 30 to 50 prompts that mirror real buyer language, categorize each by intent, and run the same set on a fixed weekly or monthly cadence. That structure separates a one-off curiosity check from a trend you can actually act on.
Write Prompts That Surface Citation Behavior, Not Just Answers
The goal is to trigger the kind of response where an AI engine names a source, links to a page, or attributes a claim to a specific brand or publication. Generic prompts like "what is content marketing?" rarely do that. Specific, evaluative prompts do.
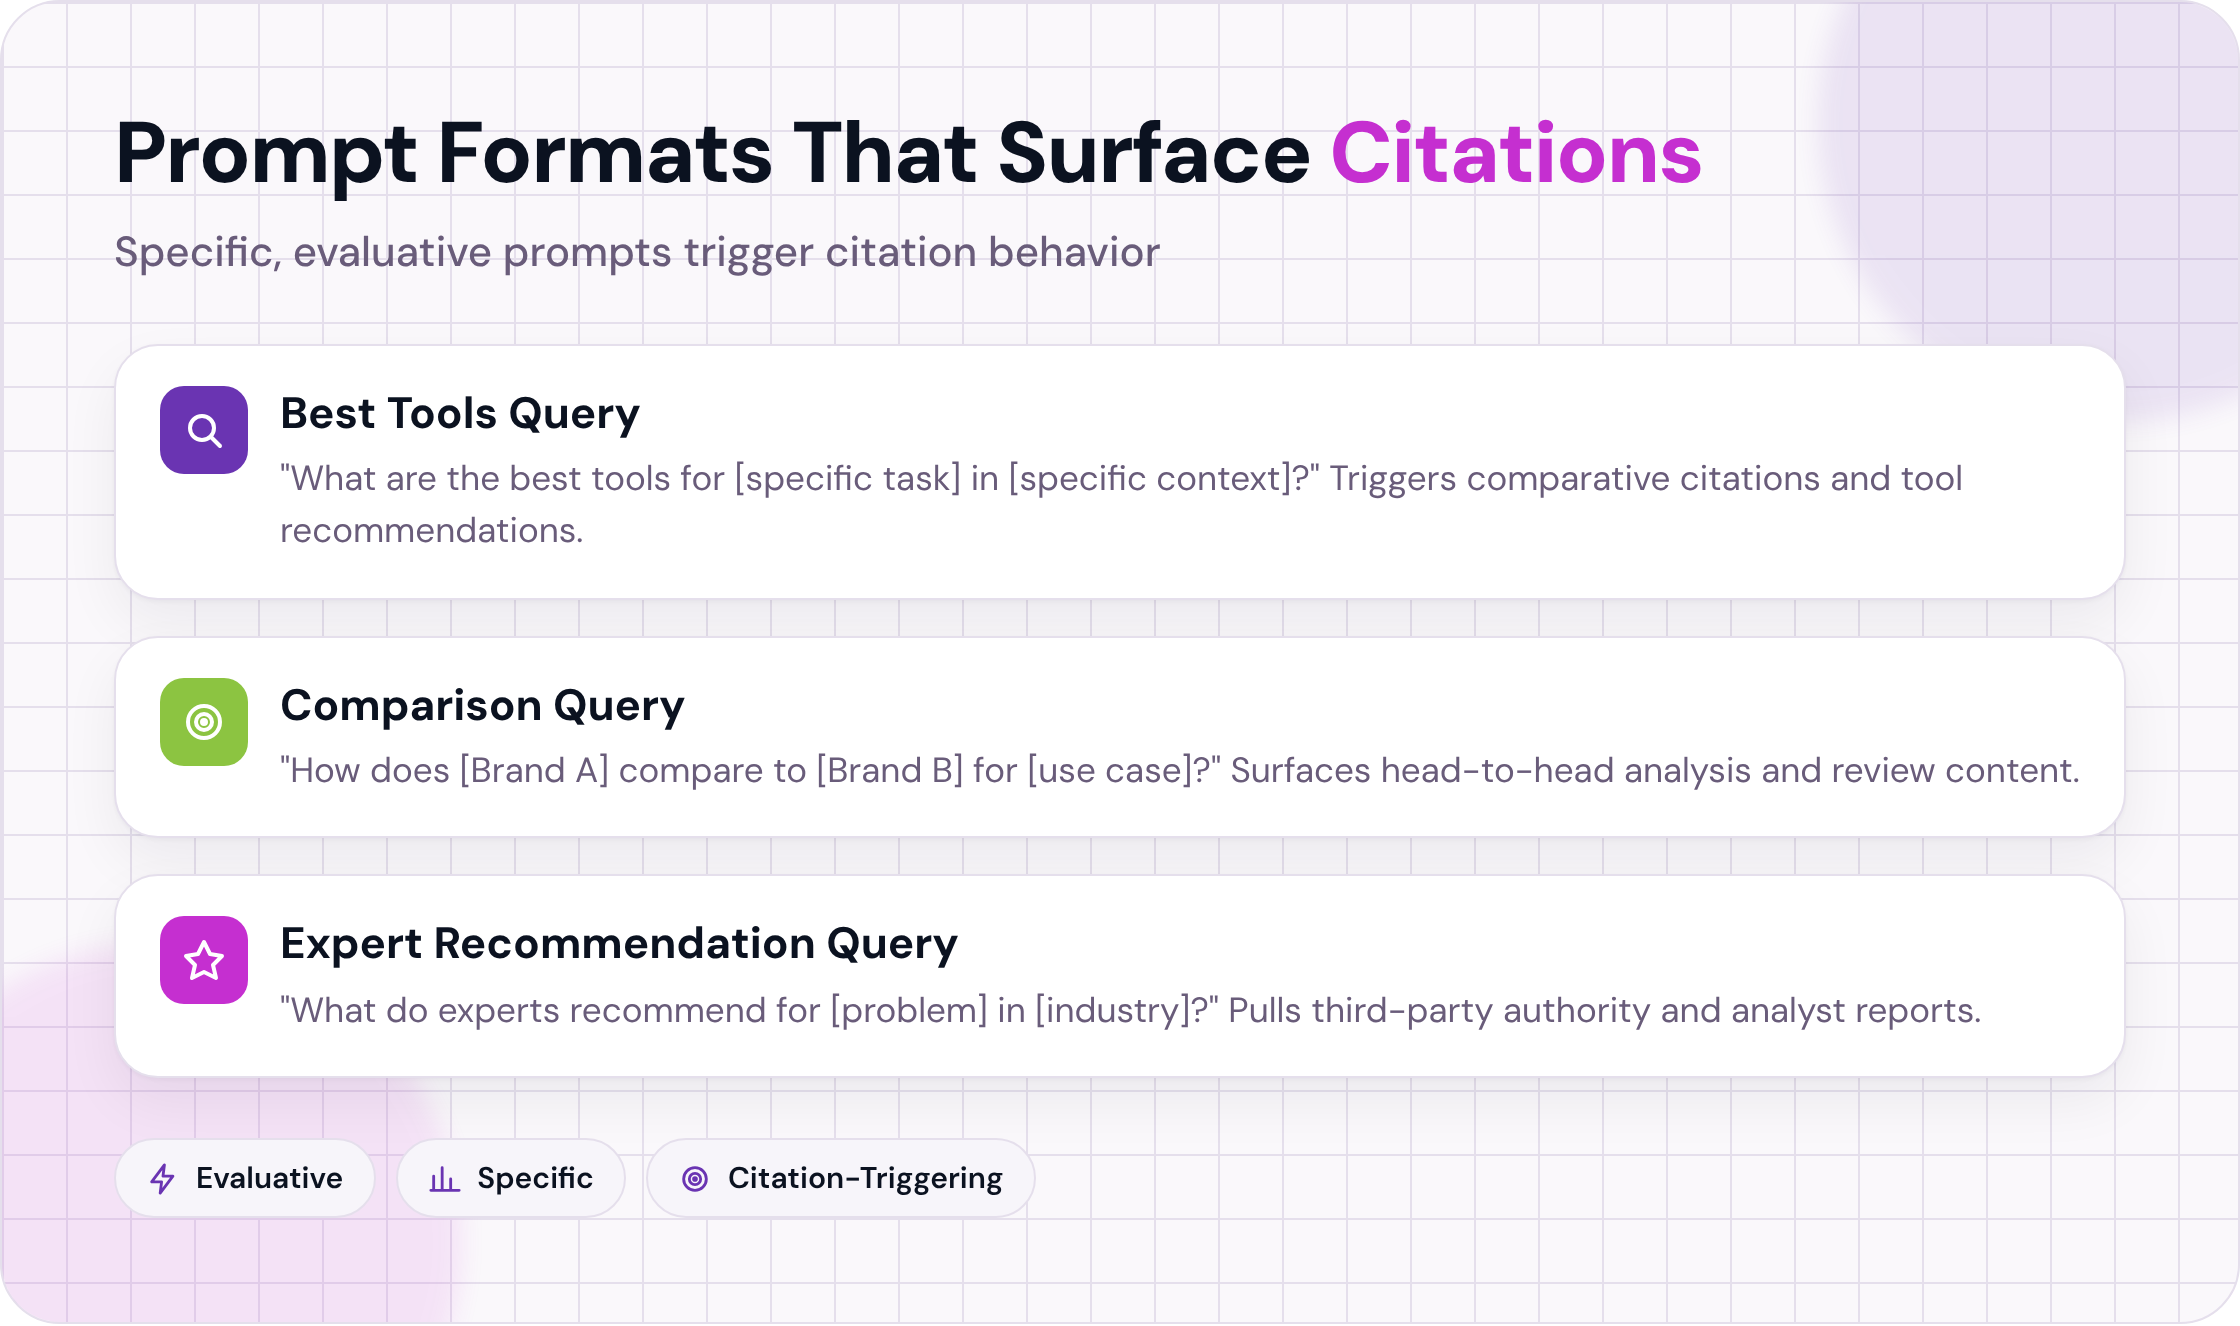
A few formats that consistently surface citations:
- "What are the best tools for [specific task] in [specific context]?"
- "How does [Brand A] compare to [Brand B] for [use case]?"
- "What do experts recommend for [problem] in [industry]?"
The phrasing matters because AI engines are more likely to cite third-party sources when a prompt implies comparison or recommendation rather than simple definition. Airops' guide to LLM brand citation tracking makes this explicit: prompts built around real buyer questions surface citation behavior far more reliably than category-level definitions.
Categorize by Intent: Informational, Comparative, and Brand-Specific
Grouping prompts by intent lets you diagnose where your brand is visible and where it is absent.
| Intent Type | Example Prompt | What It Reveals |
|---|---|---|
| Informational | "How do I reduce SaaS churn?" | Whether your content ranks as a general authority |
| Comparative | "Is [Your Brand] better than [Competitor] for mid-market teams?" | Direct brand visibility in decision-stage queries |
| Brand-specific | "What do people say about [Your Brand]?" | Sentiment and third-party attribution patterns |
Aim for roughly 40% informational, 40% comparative, and 20% brand-specific. That ratio gives you enough signal on general authority without over-indexing on branded queries, which tend to return predictable results regardless of your actual citation share.
Store and Version Your Prompt Library So Results Stay Comparable
A prompt that changes between runs produces data you cannot compare. Even small edits, like adding a word or changing punctuation, can shift which sources an AI engine cites. Store your prompts in a versioned document or spreadsheet with columns for prompt text, intent category, date added, and any edits made. Freeze a version before each measurement cycle and never edit a live prompt mid-cycle.
The trade-off here is real: maintaining a frozen prompt set means you will eventually have prompts that no longer reflect how buyers actually search. Language drifts. New product categories emerge. A prompt written in early 2024 about "AI writing assistants" may feel dated by late 2025. The fix is to run a quarterly review where you retire stale prompts and add new ones, but always log the change so you know exactly when the library shifted. That way your trend data stays clean even as the library evolves.
Step 2: Run Queries and Log Citation Responses Systematically
To measure LLM citation share, submit the same prompts to each AI engine on a fixed schedule, then record every URL cited in the response along with the surrounding context, the engine name, the date, and a prompt ID. Without that structure, you have spot checks, not data. Spot checks tell you whether you were cited once. Logged, timestamped records tell you whether your share is growing.
Manual Logging vs. API-Based Automation
Manual logging works when you are tracking fewer than 20 prompts across two or three engines. Open each interface, run the query, copy the response into a spreadsheet, and tag the fields by hand. It takes roughly 15 to 20 minutes per session, and the upside is that you see the full response text, which often reveals context that automated parsers miss.
The trade-off is straightforward: manual logging does not scale. Once you are tracking 50 or more prompts across ChatGPT, Perplexity, Claude, and Gemini simultaneously, session time compounds fast and human error creeps into the tagging. A missed citation in week three quietly corrupts your trend line.
API-based automation solves the volume problem. You schedule queries programmatically, parse responses with a consistent extraction script, and write results directly to a database. The limitation: not every engine exposes a stable, citation-friendly API. Perplexity's API surfaces source URLs reliably; ChatGPT's web-browsing responses are less consistent about which URLs appear in the structured output versus inline text. Build your parser to handle both formats, or you will undercount.
Tools That Track Automatically
Several platforms now run multi-engine citation monitoring without manual intervention. The data fields they capture matter as much as the engines they cover. A row in your citation log should include at minimum: the cited URL, the anchor context (the sentence or phrase surrounding the citation), the engine, the date, and the prompt ID. Prompt ID is the field most teams skip, and it is the one that lets you filter by topic cluster later.
Consistent logging structure is what LLM evaluation best practices from Microsoft's data science team identify as foundational to any reliable measurement system. Without a repeatable input-output schema, you cannot compare results across time or engines.
One more limitation worth naming: AI engines do not always cite the same URL twice for the same prompt. Response-level variance means a single query run on Monday and again on Friday can return different citations even when the underlying content has not changed. Run each prompt at least twice per measurement period and log both responses. Averaging across runs gives you a more stable citation rate than any single data point can.
Step 3: Calculate Your Citation Share Score
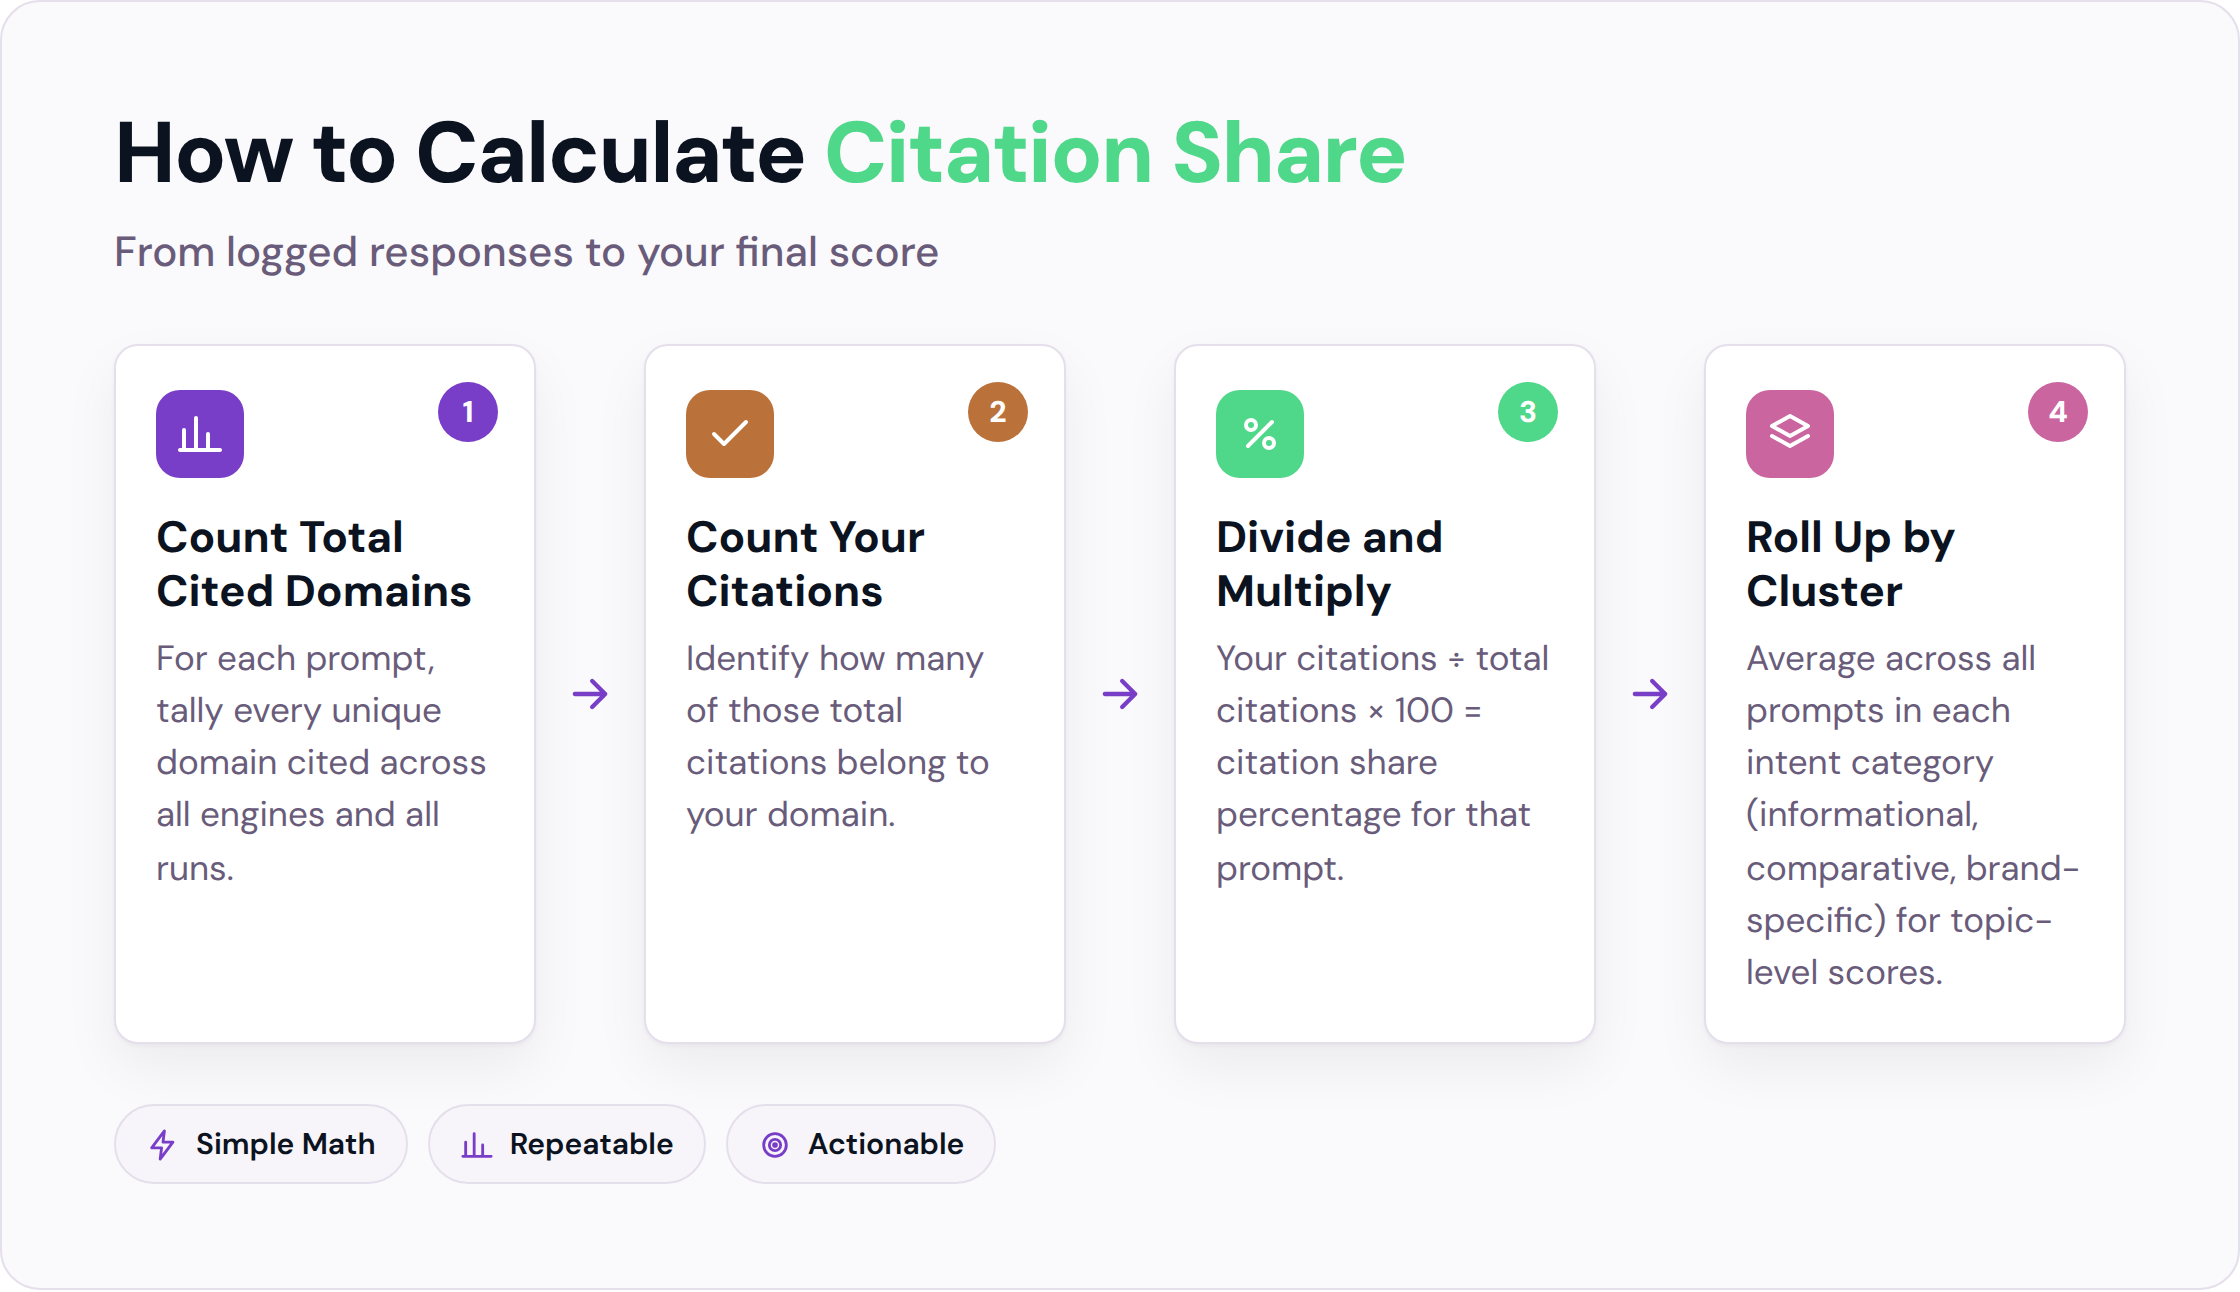
Once you have a full cycle of logged responses, the calculation is straightforward. For each prompt, count the total number of unique domains cited across all engines and all runs. Then count how many of those citations belong to your domain. Divide your count by the total and multiply by 100. That is your citation share for that prompt.
Roll it up to the topic cluster level by averaging across all prompts in a given intent category. A brand with 3 citations out of 60 total cited slots across 20 informational prompts has a 5% citation share on informational queries. Do the same for comparative and brand-specific clusters. The gap between your informational share and your comparative share usually tells you something useful: brands that rank well on educational content but disappear on comparison queries are often absent from the review aggregators and third-party roundups that AI engines pull from heavily.
Track the number week over week, not just the absolute figure. A jump from 3% to 6% citation share on comparative queries after you published a detailed comparison page is a signal worth acting on. A drop from 8% to 4% after a competitor launched a new content push is a signal worth investigating.
Step 4: Diagnose What Is Driving Your Score
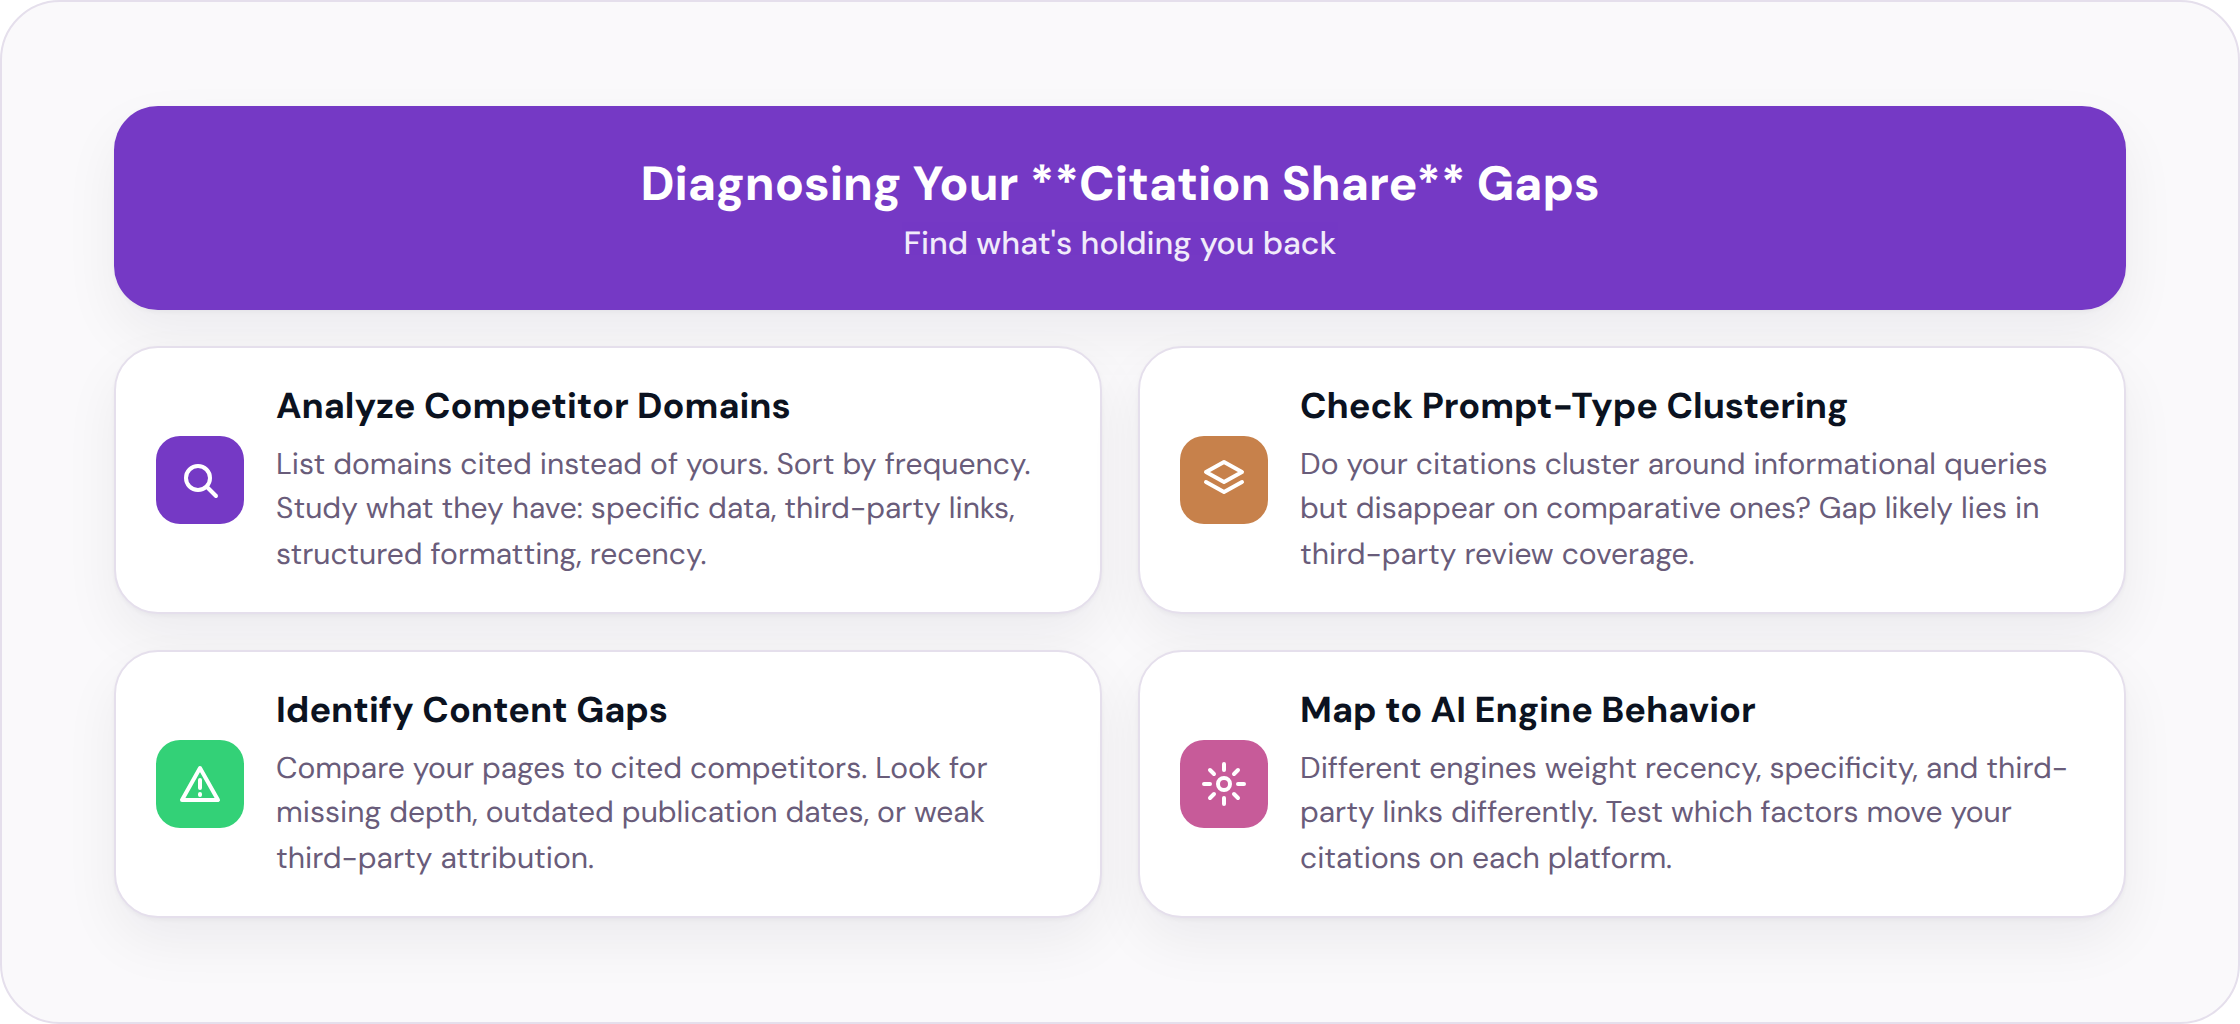
Raw citation share tells you where you stand. Diagnosing the drivers tells you what to do about it.
Start by pulling the full list of domains that are being cited instead of yours on the prompts where you are absent. Sort by frequency. The domains appearing most often are the ones AI engines have decided are authoritative on your topic. Look at what those pages have that yours do not: more specific data, more third-party links pointing to them, more structured formatting, or more recent publication dates.
Next, check whether your cited appearances cluster around specific prompt types. If you are getting cited on informational queries but not on comparative ones, the gap is likely in third-party coverage. AI engines cite comparison content from review sites, analyst reports, and independent roundups far more than they cite brand-owned pages for head-to-head queries. Getting cited on comparative prompts often requires earning coverage on those third-party properties, not just publishing your own comparison content.
Finally, look at the anchor context in your citation logs. The sentence or phrase surrounding your citation tells you what claim the AI engine is attributing to you. If you are being cited for a narrow data point rather than a broad recommendation, your citation share may be technically present but strategically thin.
Frequently Asked Questions
How often should I run my citation share queries?
Weekly is the right cadence for most teams. AI engine behavior shifts with model updates, index refreshes, and changes in the competitive content landscape, so monthly data misses meaningful short-term swings. If you are running a content experiment, weekly data lets you see whether a new page is getting picked up within 30 to 45 days of publication rather than waiting a full quarter.
Does citation share correlate with traditional SEO rankings?
Partially, but the correlation is weaker than most teams expect. High-authority domains tend to rank well in both traditional search and AI citations, but the specific pages that get cited by AI engines are not always the same pages that rank on page one of Google. AI engines weight recency, specificity, and third-party attribution patterns differently than Google's ranking algorithm does. You can have a page ranking in position two on Google and never appear in a Perplexity citation for the same query.
What counts as a citation for measurement purposes?
Count any instance where an AI engine names your domain, links to a specific URL on your site, or attributes a claim directly to your brand by name in a way that a reader could trace back to you. A vague mention like "some brands offer this feature" does not count. A named attribution like "according to [Your Brand]'s 2025 benchmark report" does. When in doubt, apply the traceability test: could a reader find your specific page from the information given? If yes, count it.
How many prompts do I need for a statistically meaningful citation share?
Thirty prompts is a workable floor for a single topic cluster. Below that, one or two citation swings can move your percentage by 10 points or more, making it hard to tell signal from noise. Fifty prompts across three intent categories gives you enough data to spot directional trends within four to six weeks of consistent tracking. If you are tracking multiple product lines or geographic markets, treat each as a separate prompt set rather than mixing them into one pool.
Can I measure citation share without API access?
Yes, though it is slower. You can run prompts manually in each engine's web interface, copy the full response text into a spreadsheet, and tag citations by hand. The main risk is inconsistency: manual sessions are harder to schedule precisely, and small variations in how you phrase a prompt during copy-paste can introduce noise. If you go the manual route, copy the exact prompt text from your versioned library each time rather than retyping it.
What is a good citation share benchmark?
There is no universal benchmark yet, and anyone claiming one is working from a small sample. What the available data suggests, based on 2026 LLM citation statistics, is that most brands in competitive categories sit below 5% citation share on non-branded queries. Breaking 10% on a specific topic cluster is a meaningful signal that your content is being treated as a category authority by at least one major engine. Use your own trend line as the primary benchmark rather than industry averages until more standardized data exists.
If you want a clearer picture of where your brand stands in AI-generated answers, visit Seorav's GEO service page to see how to measure LLM citation share across the engines that matter to your audience and start building a tracking program that produces data you can actually use.
Keep reading
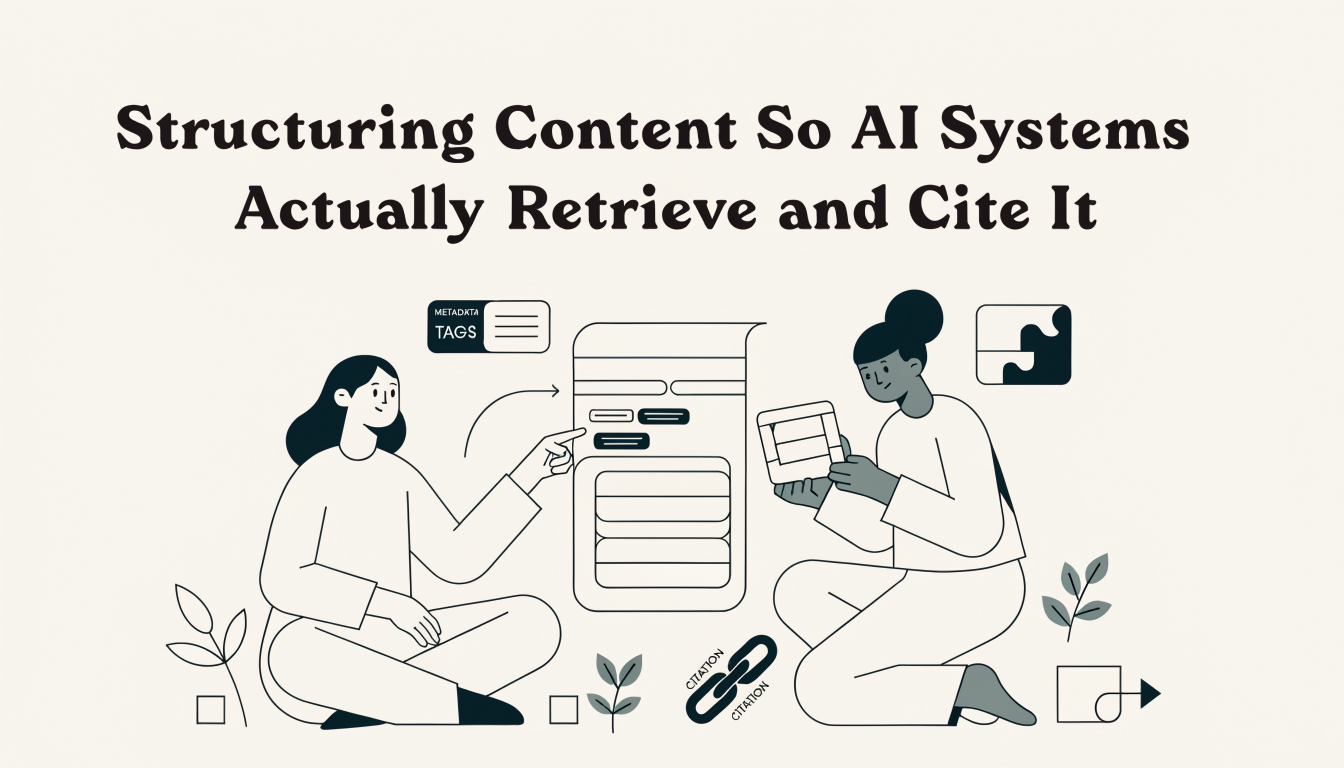
Structuring Content So AI Systems Actually Retrieve and Cite It
Learn how to structure content for RAG retrieval using semantic chunking, HowTo schema, and answer-first headings that AI systems actually cite.
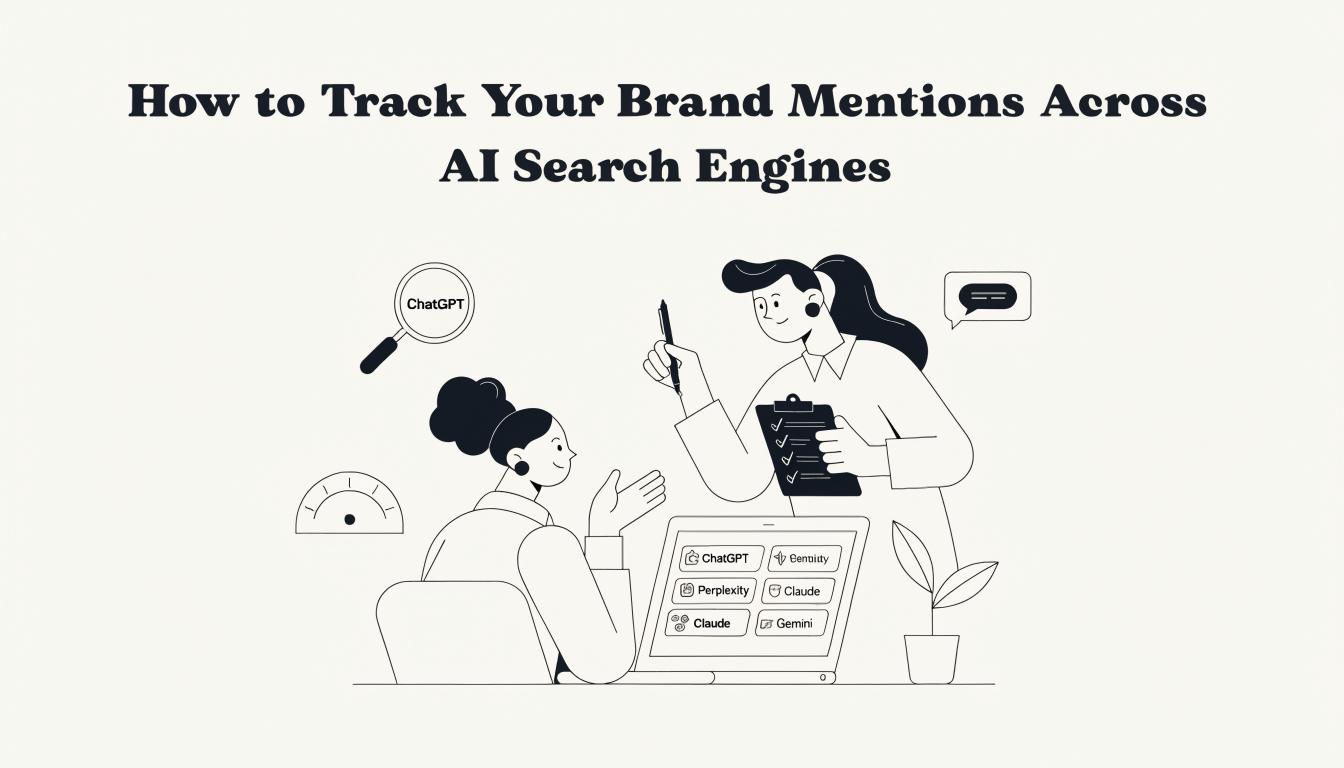
How to Track Your Brand Mentions Across AI Search Engines
Learn how to track brand mentions in AI search across ChatGPT, Perplexity, Claude, and Gemini. Manual methods, tool comparisons, and gap-closing tactics in
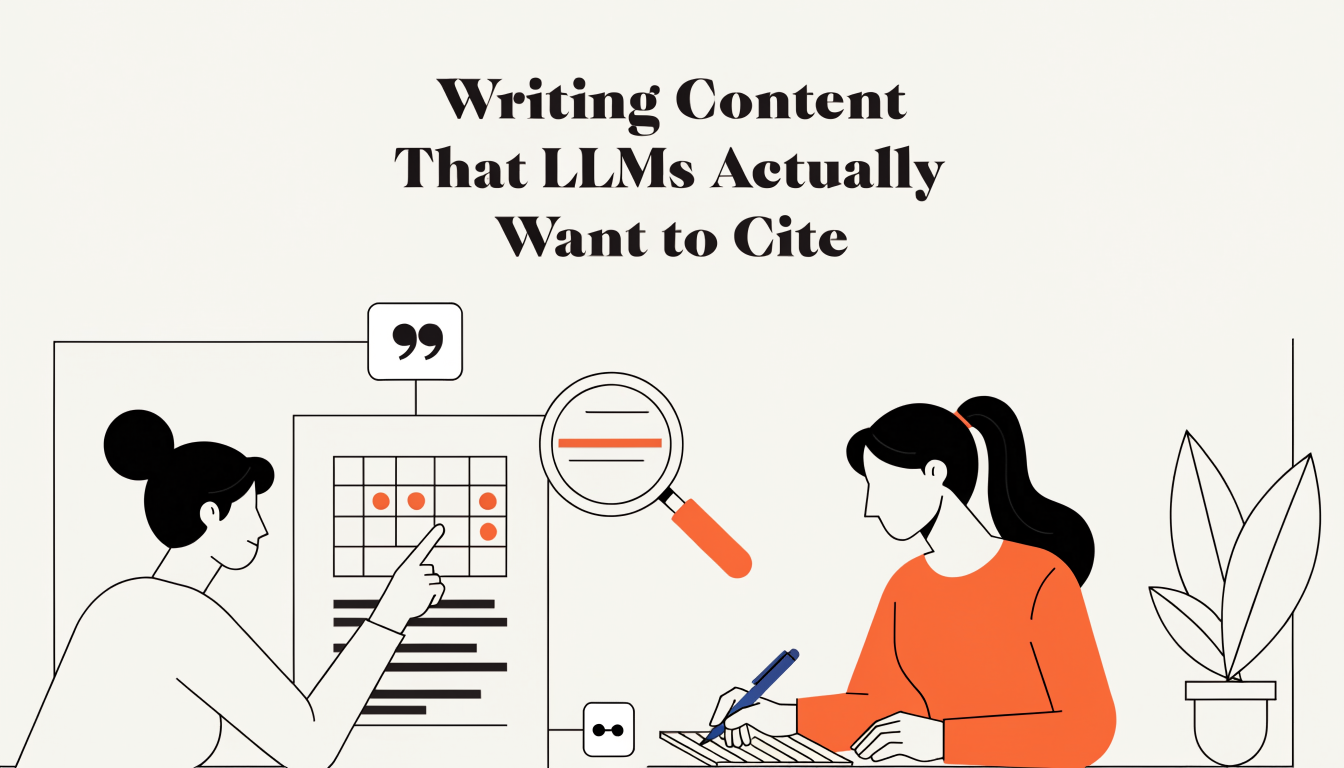
Writing Content That LLMs Actually Want to Cite
Learn how to write distinctive content LLMs will cite: original data, expert attribution, structured formatting, and freshness signals that clear the retri