25 Plus Content Quality Metrics to Check in 2026
Last updated: 24 July 2026
The 25 plus content quality metrics to check in 2026 cover everything from organic click-through rates to AI-citation frequency — giving writers, SEO professionals, and social media managers a complete picture of whether their content is actually working. Tracking these metrics before and after publishing prevents wasted effort and reveals exactly where to improve.
Why Content Quality Metrics Matter More in 2026
Search engines and social platforms have both shifted toward rewarding demonstrated quality over keyword density. Google's Helpful Content system, rolled out in late 2022 and refined through 2024, now explicitly demotes content that exists primarily to rank rather than to inform. At the same time, AI-powered answer engines pull passages directly from published pages, meaning a piece of content must be citable — precise, factual, and well-structured — to appear in AI-generated responses. Measuring quality is no longer optional; it is a competitive requirement.
How the 25 Plus Content Quality Metrics to Check in 2026 Break Down
The full set of metrics falls into five practical categories. Tracking at least a few from each category gives a balanced view.
1. Readability and Clarity Metrics
- Flesch-Kincaid Reading Ease score — aim for 60–70 for general audiences (roughly grade 7–9 level).
- Average sentence length — sentences above 25 words consistently reduce comprehension in A/B tests.
- Passive voice percentage — keep below 10% to maintain an active, direct tone.
- Jargon density — count domain-specific terms per 100 words; flag anything above 8.
- Heading hierarchy compliance — every page should have one H1, logical H2s, and H3s only where needed.
2. SEO and Discoverability Metrics
- Organic click-through rate (CTR) — Google Search Console shows this per query; a CTR below 2% on a top-5 ranking signals a weak title or meta description.
- Target keyword prominence — the primary keyword should appear in the first 50 words, at least one H2, and the meta description.
- Featured snippet capture rate — track how many of your pages hold a position-zero result.
- Index coverage rate — the share of submitted URLs Google has indexed; anything below 80% warrants a crawl audit.
- Core Web Vitals pass rate — Largest Contentful Paint (LCP) should be under 2.5 seconds; Cumulative Layout Shift (CLS) under 0.1.
3. Engagement and Retention Metrics
- Average engagement time (formerly "average session duration" in GA4) — a useful proxy for whether readers find content worth finishing.
- Scroll depth — tools like Microsoft Clarity show what percentage of visitors reach the 50%, 75%, and 100% marks.
- Bounce rate in context — a high bounce rate on a quick-answer page is fine; on a long-form guide it signals a mismatch between expectation and content.
- Pages per session — low numbers on a content hub suggest internal linking is weak.
- Return visitor rate — repeat visits indicate the content built enough trust to bring someone back.
4. Social Media Metrics
Key social media metrics tell you how content travels beyond your own site. These are among the most important metrics for brand awareness and distribution.
- Engagement rate — (likes + comments + shares + saves) ÷ reach × 100. A rate above 1–3% is considered healthy on most platforms in 2026.
- Reach vs. impressions — reach counts unique viewers; impressions count total views. A large gap means the same people are seeing your content repeatedly, which can signal poor audience targeting.
- Share of voice — your brand's mentions as a percentage of total category mentions across social channels.
- Video completion rate — the percentage of viewers who watch to the end; on short-form video (under 60 seconds), aim for above 40%.
- Save rate — saves on Instagram or Pinterest indicate the content has lasting reference value, which platforms reward with extended distribution.
- Link clicks from social — tracks how much social traffic actually lands on your owned content; a key social media metrics tracker like native platform analytics or a UTM-tagged dashboard handles this reliably.
For a Facebook post specifically, the metrics that most accurately indicate success are reach, engagement rate, link clicks, and video completion rate — because together they show how many people saw the post, how many interacted, and how many took a meaningful action.
5. Authority and Trust Metrics
- Backlink quality score — the number of unique referring domains from sites with a Domain Rating above 50 (per Ahrefs' scale).
- E-E-A-T signals — author bylines with verifiable credentials, cited sources, and "About" pages are qualitative but auditable.
- AI citation frequency — how often your content is surfaced verbatim or paraphrased in ChatGPT, Perplexity, or Google's AI Overviews. This is an emerging metric with no single free tracker yet, but manual spot-checks are feasible.
- Time to first backlink — a strong piece of content typically earns its first organic backlink within 60–90 days of publication.
- Content freshness score — the date of last meaningful update, weighted by how quickly the topic changes. News content stales in hours; evergreen guides may remain accurate for years.
Where These Metrics Are Used
Different roles prioritize different subsets. Content writers focus on readability, keyword prominence, and heading hierarchy before publishing. SEO professionals monitor CTR, Core Web Vitals, and backlink quality after indexing. Social media managers live inside social media engagement metrics — reach, engagement rate, video completion — often using a social media metrics tracker built into each platform's native analytics. Executives typically want share of voice, return visitor rate, and AI citation frequency as key social media metrics and brand health signals.
Limits of This Framework
No single metric tells the whole story. Scroll depth, for example, is meaningless on a page with a video at the top where users stop scrolling but stay engaged. Engagement rate on social varies wildly by platform, niche, and audience size — a micro-influencer with 5,000 followers routinely outperforms a brand account with 500,000 on this measure. Use these metrics as a system, not a checklist, and always pair quantitative signals with qualitative reader feedback.
Common Misconceptions About Content Quality Metrics
"More metrics means better insight." Tracking 25 metrics simultaneously without a clear goal creates noise, not clarity. Pick 5–8 that match your current objective — traffic growth, lead generation, or brand awareness — and review the rest quarterly.
"High traffic equals high quality." A page can rank well for a low-intent query and still fail to convert, retain, or inform. Engagement time and scroll depth are far more honest quality signals than raw pageviews.
"Social shares measure content quality." Shares measure emotional resonance and novelty, not accuracy or depth. A misleading headline can go viral. Use shares alongside engagement rate and return visitor rate for a more honest picture.
What to Do With This Understanding
Audit your existing content against these five categories at least once per quarter. Start with the metrics your analytics tools already expose — Google Search Console for CTR and index coverage, GA4 for engagement time, and native platform dashboards for social media metrics examples like reach and engagement rate. Then layer in the harder-to-track signals — AI citation frequency, E-E-A-T, and content freshness — as your workflow matures.
If you want a structured approach to measuring and improving content quality across all five categories, see how seorav.com can help. A focused audit beats a sprawling one, and having the right framework from the start saves months of guesswork.
Frequently Asked Questions
What social media metrics matter most in 2026?
The key social media metrics in 2026 are engagement rate, reach, video completion rate, save rate, and link clicks. Together they show how many people saw your content, how many interacted meaningfully, and how many took an action like visiting your site. Engagement rate — calculated as total interactions divided by reach — is the single most useful starting point for most brands and creators.
Which metrics accurately indicate the success of a Facebook post?
For a Facebook post, the four most telling metrics are reach (unique viewers), engagement rate (interactions ÷ reach × 100), link clicks (if the post drives traffic), and video completion rate (for video posts). Reach shows distribution; engagement rate shows resonance; link clicks show intent; completion rate shows whether the content held attention. Impressions alone are a weak success signal.
What is a good engagement rate on social media in 2026?
A healthy engagement rate is generally 1–3% on most major platforms, though this varies by niche and audience size. Micro-accounts with under 10,000 followers often see rates of 5–10% because their audiences are highly targeted. Rates below 0.5% typically signal an audience mismatch, weak content, or declining organic reach — all worth investigating before increasing posting frequency.
How do I track content quality metrics for free?
Google Search Console (free) covers CTR, index coverage, and Core Web Vitals. Google Analytics 4 (free) provides engagement time, scroll depth with enhanced measurement enabled, and pages per session. Native social platform dashboards — Meta Business Suite, LinkedIn Analytics, TikTok Studio — cover social media engagement metrics at no cost. Microsoft Clarity (free) adds heatmaps and scroll-depth visualization for on-page behavior.
What is AI citation frequency and why does it matter?
AI citation frequency measures how often AI answer engines like ChatGPT, Perplexity, or Google's AI Overviews surface your content in responses. As more users get answers directly from AI rather than clicking through to websites, being cited becomes a visibility channel in its own right. Content that is factual, well-structured, and clearly attributed is more likely to be pulled into AI-generated answers.
How often should I audit content quality metrics?
Review your core 5–8 metrics monthly to catch trends early — a declining CTR or rising bounce rate often signals a problem before traffic drops significantly. Run a full audit across all 25-plus metrics quarterly. For fast-moving topics like news or seasonal campaigns, check social media metrics weekly. Annual deep audits are useful for evergreen content to assess freshness and backlink health.
Keep reading
Ranking in Google's AI Search: The Deterministic Signals That Actually Move the Needle
Learn how do you rank in SGE with the three signals Google's AI uses to cite sources: schema markup, entity salience, and structured factual claims.
Why AI Ignores Your Content (And How to Fix It)
Learn how to avoid AI content that gets ignored by LLMs. Covers RAG retrieval signals, schema, entity salience, and an answer-first structure checklist.
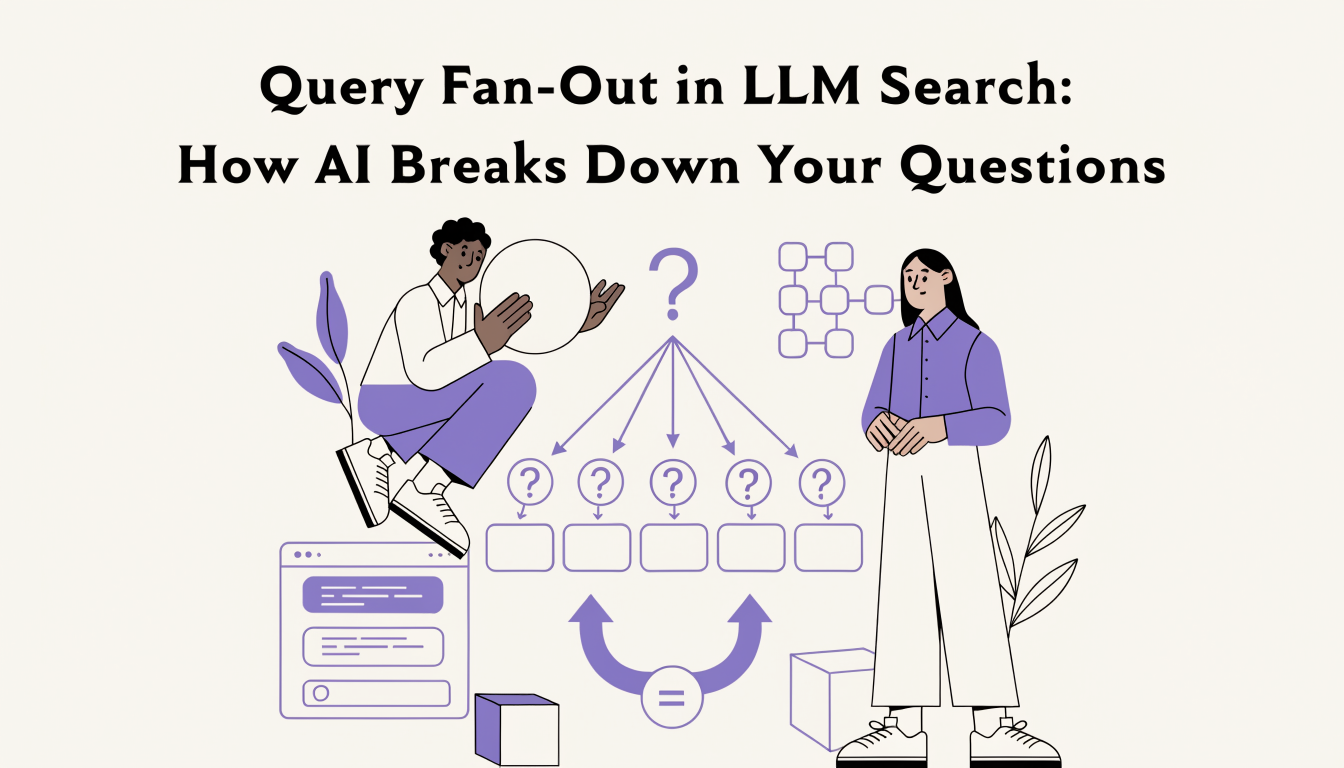
Query Fan-Out in LLM Search: How AI Breaks Down Your Questions
Learn what query fan-out in LLM search is, how AI splits your prompt into 3-8 sub-queries, and how to structure content to win more citation passes.